Research Article | | Peer-Reviewed

Comparison of Effect of Organic and Inorganic Fertilizer on Soil Chemical Properties in Spinach Production

Received: 11 March 2026     Accepted: 25 March 2026     Published: 10 April 2026
Views:       Downloads:
Abstract

The research work was conducted in November 2024 at Field laboratory of Institute of Environmental Science, Rajshahi University Rajshahi to study the comparison of effect of organic and inorganic fertilizer on soil chemical properties in Spinach production. There were six treatments in this experiment. The experiment was laid out in randomized complete block design (RCBD) with three replications. Each block was compacted with a 6unit plot. Thus, the total numbers of unit plots were 18. The unit plot was 4m×1.25m = 5.0m2 having plot to plot 0.5m and 1m from surrounding the boundary. The unit plots were separated with earthen bunds to avoid nutrient transfer to besides plot by lateral seepage. This study evaluated the impact of six different soil treatments (T0–T5) on the dynamics of soil organic matter (SOM), macronutrients (N, P, K), and micronutrients (S, Zn, B) from pre-cultivation to post-harvest. Results indicate that while cultivation generally leads to nutrient depletion, specific management protocols can mitigate these losses and enhance soil fertility. Statistical analysis revealed that Total Nitrogen (TN) and Available Phosphorus (P) were significantly influenced by the treatments (and, respectively). Treatment T5 emerged as the superior protocol, achieving the highest net gains in TN (+0.04%) and Available P (+2.20 mg/kg). In contrast, the control (T0) and T2 experienced substantial phosphorus depletion (up to -10.02 mg/kg). A notable inverse relationship was observed between SOM and TN; while SOM decreased in most plots due to microbial mineralization, TN levels rose, suggesting a high rate of organic nitrogen conversion. Regarding micronutrients, Sulfur (S) and Boron (B) levels showed highly significant variations. T5 demonstrated the best performance in minimizing Sulfur loss (-1.46mg/kg) and maximizing Zinc (Zn) accumulation (+0.08mg/kg). Although changes in Exchangeable Potassium (K) and SOM were recorded as non-significant (NS), the numerical trends consistently favored T5 and T4 for maintaining nutrient stability. Overall, Treatment T5 provided the most balanced nutrient profile, effectively preventing the "nutrient mining" seen in other treatments. This study recommends T5 as an optimal strategy for sustaining soil health and ensuring long-term productivity in intensive cropping systems.

Published in American Journal of Environmental and Resource Economics (Volume 11, Issue 1)
DOI 10.11648/j.ajere.20261101.12
Page(s) 14-23
Creative Commons

This is an Open Access article, distributed under the terms of the Creative Commons Attribution 4.0 International License (http://creativecommons.org/licenses/by/4.0/), which permits unrestricted use, distribution and reproduction in any medium or format, provided the original work is properly cited.

Copyright

Copyright © The Author(s), 2026. Published by Science Publishing Group

Keywords

Nutrient Dynamics, Soil Fertility Management, Mineralization, Macronutrients and Micronutrients, Sustainable Agriculture, Phosphorus Depletion

1. Introduction
Spinach (Spinacia oleracea L.) is one of the most popular green leafy vegetable crops grown in Bangladesh. It is used fresh vegetables mostly in winter season. Spinach belongs to the Amaranthaceae family . It is low in calories and a good source of vitamin C, vitamin A and minerals especially iron . Spinach is a vegetable with a high biological value, extremely rich in antioxidants especially when fresh, steamed, or quickly boiled . Spinach is a good source of vitamin A, C, E, K, B2, B6, B9, folic acid, minerals (Mn, Mg, Fe, K, Ca, Se), and dietary fiber . It is well said spinach is one of the healthiest green vegetables in human food for its high concentration’s phytonutrients and health prompting compound .
Soil health is assessed in term of soil physical properties, soil chemical properties and soil biological properties. Major nutrient N, P, K and micronutrient had vital role on soil physiochemical properties. Addition of organic matter changes the soil environment Traditionally used sources of nutrient replaced by chemical fertilizer after green revolution and chemical fertilizer increased productivity but inappropriate use of chemical fertilizers leads to soil an environmental pollution declining soil quality Continuous use of chemical fertilizer causes decrease of soil fertility and quality of agricultural land as well as soil organic matter (SOM) depletion Organic fertilizer increases nitrogen content and soil carbon resulting crop productivity and soil fertility. Moreover, organic fertilizers are eco-friendly and cost effective Organic fertilizer can boost yield of crop by enhancing nutrient cycling. Microbial function can be improved by organic fertilizer. Organic fertilizer application is currently recommended for this .
Whole ecosystems may be impacted by human activities that harm soil health. However, judicial use of fertilizer, use of organic fertilizer, integrated pest management had prior interest.
To restore soil health and lessen dependency on chemical fertilizer, farmers can also think about utilizing organic fertilizers and sustainable farming practices. With conceiving the above scheme in mind, the present research has been undertaken.
Objectives:
To compare the effect of different sources of nutrients on soil chemical properties.
To determine the effect of sources of nutrients on yield of Spinach.
To find out eco-friendly source of nutrient.
2. Materials and Methods
2.1. Experimental Site
The research work was conducted in the experimental field of Institute of Environmental Science, University of Rajshahi 2024
In Rabi (16 October to 15 March) season. Spinach (Spinacia oleracea) was cultivated. The area is situated at 24022 North latitude and 88036ʹ East longitude which is 18.0m above sea level.
2.2. Experimental Treatment
The experiment was laid down in a randomized complete block design (RCBD) with three replications having six treatments. Each plot was 5m2. Experimental treatments were T0=control, T1=Recommendation dose of fertilizer, T2=10%extra of recommendation dose of fertilizer, T3=cow dung, T4= vermicompost and T5= Trichocompost. The seed was sown on14 November 2024 and harvested as in 40 Days old.
2.3. Vegetable Cultivation Method
Land was prepared for several times by spade to obtain the desirable tilth. After this laddering was done to level the soil. A wooden hammer was used to break the large mud into small pieces. Weeds and others stubbles were removed from the field. Land became smooth and then seed sowing was completed. Organic fertilizers were incorporated in soil 15 days before land preparation. Inorganic fertilizers were mixed during final land preparation. Further all agricultural practices like irrigation, weeding was done as requirement.
2.4. Soil Samples Collection
Soil samples were collected before one month of sowing. Samples were collected randomly from the field in depth of 6 inch by the help of spade. The soil sample was dried and packaged in polythene bags then send laboratory for test. After harvesting soil samples from each plot were collected as described before and send to lab.
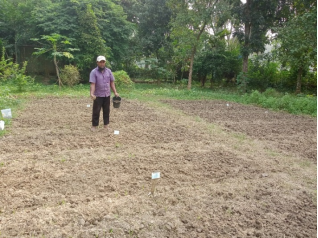
Figure 1. Experimental plot in the Research Field of Institute of Environmental Science, University Campus.
2.5. Data Collection
Yield was measured in kg per decimal.
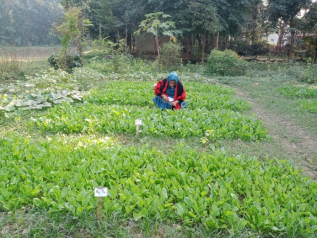
Figure 2. Data collection from the Research Field of Institute of Environmental Science, Rajshahi University Campus.
2.6. Soil Chemical Properties Measurement
Soil pH:
Measurement of pH was done by HANNA HI 9210 ATC pH meter.
Organic matter:
Organic carbon content of the soil was volumetrically determined by wet digestion method Organic matter was determined by multiplying organic carbon with Van Vemelon factor (1.724).
Total nitrogen:
Total N in the soil was determined by the semi-micro Kjeldahl method.
Exchangeable potassium:
Potassium was determined by flame photometer.
Available phosphorus:
Phosphorus was extracted by shaking the soil with 0.5m sodium bicarbonate solution having pH 8.5. The extractable P in solution was then determined spectrophotometer at 890 nm wave length after developing blue color using molybdate-ascorbic acid .
Available Sulphur:
The available Sulphur content in the soil was extracted by 0.01 M Ca(H2PO4)2. The extracted S was estimated turbid metrically and the turbidity was measured by Spectrophotometer at 420nm .
Boron:
Boron was determined by Atomic Absorption Spectrophotometer 420nm.
Zinc:
zinc content in the soil was extracted with AAS. The available zinc content in the soil could extracted with 0.05 M HCl and the concentration of Zn in the extract were measured directly by Atomic Absorption Spectrophotometer at 214 nm.
3. Results and Discussion
According to this study inorganic fertilizer had adverse effect on chemical properties of the soil. Yield of spinach increased by chemical fertilizer application but organic fertilizer showed better chemical properties of soil as well as much more yield than control plot.
3.1. Yield of Spinach
In this experiment, treatment T1 showed the highest value (52.05kg/decimal) and treatment T0 had lowest yield. organic plot T5 and T4 had insignificant deference. Due to Quick supply of nutrient inorganic plot showed maximum yield.
Table 1. Yield of spinach in kg/decimal.

Treatments

Yield of spinach kg/decimal

T0

34.40d

T1

52.05a

T2

50.32a

T3

41.08c

T4

45.47b

T5

45.61b

LS

***

CV

0.14

(Note: LS denotes Level of Significance; ***indicates highly significant differences at p< 0.001; differences)
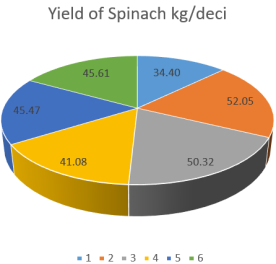
Figure 3. Yield of Spinach kg/Decimal in the Research Field of Institute of Environmental Science, Rajshahi University Campus.
3.2. Chemical Properties of Soil
3.2.1. Soil pH
Soil may be alkaline or acidic due to its pH value. Alaline soil had greater pH. In this study soil pH insignificantly affected but maximum decrease was (–0.16) in T5 treatment and the highest increase (+0.34) in T! treatment.
Organic fertilizer produces organic acids that might lead to decline of soil pH. found that organic amendments reduced soil pH in alkannin soil.
Table 2. Effects of various treatments on soil pH before cultivation and after harvest, including the net numerical change.

Treatment

Before cultivation

After harvest

Changes

T0

8.36

8.50

+0.14

T1

8.16

8.50

+0.34

T2

8.20

8.40

+0.20

T3

8.13

8.20

-0.06

T4

8.23

8.20

-0.03

T5

8.30

8.13

-0.16

LS

NS

(Note: LS denotes Level of Significance, NS indicates non-significant differences)
3.2.2. Organic Matter
Organic matter in T3 treatment that was cow dung treatment had increased trend. Maximum decline was in T2 treatment. Organic inputs increased the value of organic matter had the similar result.
Table 3. Effects of various organic matter treatments on soil organic matter content (measured in percentage) before cultivation and after harvest, including the net numerical change.

Treatment

Before cultivation

After harvest

Change

T0

1.18

0.97

-0.20

T1

1.17

1.06

-0.11

T2

1.38

0.94

-0.44

T3

1.10

1.21

+0.11

T4

1.10

1.08

-0.02

T5

1.14

0.97

-0.17

LS

NS

(Note: LS denotes Level of Significance; NS indicates non-significant differences)
The data in Table 3 illustrates the fluctuations in soil organic matter (SOM) levels across six different treatments (T0–T5) over the course of the growing season.
Initial SOM levels ranged from 1.10% to 1.38% prior to cultivation. Following the harvest, most treatments exhibited a net decrease in organic matter, likely due to microbial mineralization and nutrient uptake by the crop. Notably, Treatment T2 showed the most significant depletion, with a reduction of 0.44%.
In contrast, Treatment T3 was the only group to demonstrate an increase in organic matter (+0.11%), suggesting that this specific treatment may enhance carbon sequestration or provide sufficient organic inputs to offset natural degradation. However, the Level of Significance (LS) is marked as Non-Significant (NS), indicating that the observed variances between these treatments did not reach statistical significance under the conditions of this study.
3.2.3. Total Nitrogen
Highest increase was inT5 (+0.04) which was trichocompost treatment. Significant result was found in case of total nitrogen. The existence of N aids microbial activity in soil. Addition of biomass and microbial activity lead more decomposition of organic fertilizer. The result of Iqbal et al. was close to this investigation .
Table 4. Comparison of total nitrogen concentration (%) in soil across different treatments (T0–T5) measured before cultivation and after harvest, showing the net temporal change.

Treatment

Before cultivation

After harvest

Change

T0

0.07

0.10

+0.03

T1

0.10

0.11

+0.01

T2

0.08

0.09

+0.01

T3

0.08

0.09

+0.01

T4

0.09

0.12

+0.03

T5

0.08

0.12

+0.04

LS

*

(Note: LS denotes Level of Significance; *indicates significant differences at p< 0.05)
The analysis of total nitrogen (TN) levels, as presented in Table 4, reveals a consistent upward trend across all experimental groups from the pre-cultivation phase to the post-harvest period. Unlike the organic matter trends observed previously, every treatment (T0–T5) resulted in a positive net change, with nitrogen accumulation ranging from +0.01 to +0.04%.
Treatment T5 exhibited the highest nitrogen enrichment (+0.04%), followed closely by T0 and T4 (+0.03%). The increase in TN across all plots suggests that nitrogen inputs whether through fertilization, nitrogen fixation, or mineralization of organic residues outpaced the rate of nitrogen removal by the crop.
Critically, the Level of Significance (LS) is marked with an asterisk (*), indicating that these variations are statistically significant. This suggests that the differences in nitrogen retention are a direct result of the specific treatment applications rather than random environmental variance.
Comparison of Organic Matter and Total Nitrogen Dynamics
A comparison of Table 3 and Table 4 reveals an inverse relationship between Soil Organic Matter (SOM) and Total Nitrogen (TN) during the growing period. While most treatments experienced a depletion of organic matter, they simultaneously showed an accumulation of total nitrogen.
Inverse Correlation: In five out of six treatments (T0, T1, T2, T4, T5), SOM decreased (average loss of -0.19%) while TN increased (average gain of +0.02%).
Mechanism of Change: This trend is primarily driven by nitrogen mineralization. As soil microorganisms decompose organic matter to meet their energy needs, they release "locked" organic nitrogen into inorganic forms like ammonium and nitrate.
T2 (Highest SOM Loss): Showed the most drastic organic matter decrease (-0.44%) but maintained a nitrogen increase (+0.01%), suggesting rapid decomposition.
T5 (Highest TN Gain): Achieved the maximum nitrogen increase (+0.04%) despite a significant organic matter loss (-0.17%).
T3 (The Outlier): This was the only treatment where both SOM and TN increased (+0.11% and +0.01%, respectively), indicating it may provide enough external inputs to build soil carbon while still contributing to the nitrogen pool.
It is important to note that while the nitrogen increases (Table 4) were statistically significant (*), the organic matter changes (Table 3) were non-significant (NS). This implies that the treatments had a more measurable and reliable impact on the soil's nitrogen chemistry than on its overall organic bulk during this specific time frame.
3.2.4. Available Phosphorus
Available phosphorus was significantly different in the experiment. Highest increase was inT5 (+2.20) which was trichocompost treatment and lowest in T3 Treatment residual effect of organic fertilizer trend to this increase.
Table 5. Influence of various treatments on available phosphorus concentrations (mg/kg) before cultivation and after harvest, illustrating the net nutrient depletion or accumulation.

Treatment

Before cultivation

After harvest

Changes

T0

14.23

6.63

-7.59

T1

15.03

8.03

-6.99

T2

20.33

10.13

-10.02

T3

16.01

9.47

-4.54

T4

15.9

15.60

+1.70

T5

15.5

15.7

+2.20

LS

**

(Note: LS denotes Level of Significance; **indicates highly significant differences at p< 0.01)
The data in Table 5 highlights a high degree of variability in available phosphorus (P) dynamics across the various treatments. While the majority of the groups (T0–T3) experienced substantial phosphorus depletion, treatments T4 and T5 demonstrated a unique trend of nutrient maintenance and slight accumulation.
Initial phosphorus levels ranged from 14.23 to 20.33 mg/kg. Following harvest, treatments T0 through T3 showed a dramatic reduction in available P, with T2 exhibiting the highest depletion of -10.02 mg/kg. This significant drop is likely attributed to high crop uptake or the fixation of phosphorus into insoluble forms within the soil matrix. Conversely, T4 and T5 recorded increases of +1.70mg/kg and +2.20mg/kg, respectively. These gains suggest that these specific treatments provided phosphorus inputs that exceeded the crop's demands, or effectively enhanced the solubility of indigenous phosphorus.
The highly statistically significant results (p<0.01) indicate that the choice of treatment had a profound impact on phosphorus availability. The ability of T4 and T5 to sustain or increase phosphorus levels, while other treatments suffered severe losses, suggests these protocols are superior for maintaining soil fertility and preventing nutrient exhaustion in intensive cultivation systems.
3.2.5. Exchangeable Potassium
Exchangeable potassium was insignificantly differed in the experiment. Highest increase was inT4 (+0.04) which was vermicompost treatment and lowest in T3 Treatment. organic fertilizer and chemical fertilizer supply k and reduce k fixation increase exchangeable k.
Table 6. Variation in exchangeable potassium (cmol/kg) concentrations across treatments (T0–T5) recorded before cultivation and after harvest, indicating the net temporal change.

Treatment

Before cultivation

After harvest

Changes

T0

0.24

0.20

-0.04

T1

0.24

0.18

-0.06

T2

0.28

0.19

-0.09

T3

0.21

0.19

-0.02

T4

0.24

0.28

+0.04

T5

0.26

0.28

+0.02

LS

NS

(Note: LS denotes Level of Significance; NS indicates non-significant differences)
The data presented in Table 6 highlights the dynamics of exchangeable potassium (K) throughout the cropping cycle. Prior to cultivation, soil K levels were relatively consistent across all plots, with values ranging from 0.21 to 0.28 cmol/kg.
By the end of the harvest, a clear divergence emerged between the treatment groups. Treatments T0 through T3 experienced a reduction in exchangeable K, with T2 showing the most substantial depletion (-0.09 cmol/kg). This loss typically suggests that the potassium demand for crop growth and physiological development exceeded the available supply in the soil solution. In contrast, T4 and T5 demonstrated a positive shift, with increases of +0.04 cmol/kg and +0.02 cmol/kg, respectively. These results indicate that T4 and T5 may facilitate better nutrient retention or provide sufficient supplemental K to maintain a positive soil nutrient balance.
Notably, the Level of Significance (LS) is classified as Non-Significant (NS). This implies that the variations in potassium levels among the treatments were not large enough to be statistically distinguished from random experimental error. This lack of significance suggests that, unlike nitrogen or phosphorus, exchangeable potassium levels remained relatively stable or were highly buffered by the soil's mineralogy during this specific study period.
Based on a comparative analysis of Tables 3-6, Treatment T5 emerges as the most effective protocol for maintaining and enhancing overall soil health.
While T4 also performed strongly, T5 showed the most consistent improvement across the primary nutrient indicators, particularly those with statistical significance.
Ranking Rationale for T5:
Maximum Nitrogen Gain (Table 4): T5 achieved the highest increase in Total Nitrogen (+0.04%), a result that was statistically significant (*). This suggests T5 is the most efficient at building or preserving the nitrogen pool.
Phosphorus Accumulation (Table 5): T5 showed the highest net increase in Available Phosphorus (+2.20 mg/kg). This is a critical advantage, as treatments T0–T3 suffered massive phosphorus depletion (up to -10.02 mg/kg). This finding was highly significant (**).
Potassium Stability (Table 6): While the results were non-significant (NS), T5 maintained a positive balance in Exchangeable Potassium (+0.02 cmol/kg), whereas the control and lower-tier treatments showed net losses.
Organic Matter Management (Table 3): Although T5 showed a slight numerical decrease in Organic Matter (-0.17%), the change was non-significant (NS), meaning the soil's physical structure remained relatively stable compared to the heavy losses seen in T2.
Summary of the "Best" vs. "Worst" Performers:
Table 7. Comparison of nutrient dynamics between the highest-performing (T5) and lowest-performing (T2) treatments, highlighting changes in macronutrient concentrations and organic matter stability.

Nutrient Parameter

Best Performer (T5)

Worst Performer (T2)

Total Nitrogen (%)

+0.04 (Highest Gain)

+0.01 (Lowest Gain)

Available Phosphorus (mg/kg)

+2.20 (Highest Gain)

-10.02 (Highest Loss)

Exchangeable Potassium (cmol/kg)

+0.02 (Gain)

-0.09 (Highest Loss)

Organic Matter (%)

-0.17 (Stable/NS)

-0.44 (Highest Loss)

Total Nitrogen

+0.04% (Highest Gain)

+0.01% (Lowest Gain)

Available Phosphorus

+2.20 mg/kg (Highest Gain)

-10.02 mg/kg (Highest Loss)

Exchangeable Potassium

+0.02 cmol/kg (Gain)

-0.09 cmol/kg (Highest Loss)

Organic Matter

-0.17% (Stable/NS)

-0.44% (Highest Loss)

Treatment T5 is the superior choice for sustainable cultivation. It is the only treatment that consistently ensured that Nitrogen, Phosphorus, and Potassium levels were not only maintained but slightly improved by the time of harvest.
3.2.6. Micro Nutrient (Sulfur, Zinc and Boron)
This study had significant result in sulfur and boron but zinc was insignificantly affected by treatments. Most decrease in sulfur was seen in T0 treatment which was control plot less decrease was found in T3 plot (cowdung). Zinc had insignificant result while negative trend in control and inorganic plot on the other hand increased in organic plots. Highest increase was inT5 plot.
Organic fertilizer lead efficacy of adding micronutrient in soil. More over solubilizing capacity of Zn, S retention of soil is related with organic manures .
Table 8. Comparative analysis of soil micronutrient concentrations (mg/kg) for Sulfur (S), Zinc (Zn), and Boron (B) measured before cultivation and after harvest across treatments T0–T5.

Treatment

Sulfur

Zinc

Boron

Before cultivation

After harvest

Change

Before cultivation

After harvest

Change

Before cultivation

After harvest

Change

T0

11.77

6.83

-5.13

0.70

0.67

-0.02

0.35

0.30

-0.05

T1

9.43

4.47

-4.96

0.62

0.63

-0.01

0.39

0.29

-0.10

T2

11.77

7.80

-3.97

0.63

0.56

-0.07

0.37

0.31

-0.06

T3

8.73

7.33

-1.40

0.65

0.68

+0.03

0.58

0.34

-0.24

T4

12.36

9.67

-2.69

0.62

0.69

+0.07

0.47

0.37

+0.10

T5

8.53

7.06

-1.46

0.77

0.85

+0.08

0.47

0.40

-0.07

LS

**

NS

**

(Note: LS denotes Level of Significance; **indicates highly significant differences at p< 0.01; NS indicates non-significant differences)
The dynamics of soil micronutrients (Sulfur, Zinc, and Boron) across the experimental treatments are detailed in Table 7. The data reveals a general trend of depletion for Sulfur and Boron, while Zinc exhibited more stable or positive trends in specific treatments.
1. Sulfur (S) Dynamics
All treatments experienced a reduction in available Sulfur following the harvest. Initial levels ranged from 8.53 to 12.36mg/kg, with final levels dropping significantly. The highest depletion was observed in T0 (-5.13mg/kg), whereas T3 (-1.40 mg/kg) and T5 (-1.46mg/kg) showed the least amount of loss. The highly significant (**) result indicates that the treatments varied effectively in their ability to supply or retain Sulfur, with T3 and T5 proving superior in mitigating Sulfur exhaustion compared to the control and lower-tier treatments.
2. Zinc (Zn) Dynamics
In contrast to the other micronutrients, Zinc levels remained relatively stable or improved slightly. While T2 showed the greatest decrease (-0.07mg/kg), treatments T3, T4, and T5 all demonstrated positive accumulation, with T5 showing the highest gain of +0.08mg/kg. However, the non-significant (NS) level of significance suggests that these variations were not robust enough to be attributed solely to the treatments, potentially due to the low mobility of Zinc in the soil profile.
3. Boron (B) Dynamics
Boron levels showed a predominantly downward trend, particularly in T3 (-0.24mg/kg). Interestingly, T4 was the only treatment to record a positive net change (+0.10mg/kg), while T5 showed a minor loss of -0.07mg/kg. These differences were highly significant ()**, suggesting that Boron availability is highly sensitive to the specific composition of the soil treatments applied.
Summary of Micronutrient Performance
The findings for micronutrients reinforce the overall superiority of T4 and T5. These treatments consistently demonstrated the best ability to either build up nutrient reserves (as seen with Zn and B in T4) or significantly minimize the rate of depletion (as seen with S in T5). The highly significant variances for S and B underscore that treatment selection is a critical factor in managing soil micronutrient fertility and preventing "hidden hunger" in intensive cropping systems.
4. Conclusion
The comprehensive analysis of soil macronutrients (OM, N, P, K) and micronutrients (S, Zn, B) across six experimental treatments (T0-T5) demonstrates that the choice of soil management significantly dictates the long-term fertility and nutrient sustainability of the agroecosystem.
Superiority of Treatment T5
Across all parameters, Treatment T5 emerged as the most robust and sustainable protocol. It achieved the highest significant gains in Total Nitrogen (+0.04%) and Available Phosphorus (+2.20mg/kg). Furthermore, it was the most effective at maintaining Zinc (+0.08mg/kg) and Potassium (+0.02cmol/kg) levels, while simultaneously minimizing the depletion of Sulfur (-1.46mg/kg) compared to the control group.
Nutrient Inversion and Mineralization
A critical finding of this study was the inverse relationship between organic matter and nitrogen. While most treatments (especially T2) showed a reduction in Soil Organic Matter, there was a corresponding increase in Total Nitrogen. This suggests that high microbial activity led to the mineralization of organic reserves, converting "locked" nutrients into plant-available forms. However, only T5 and T4 provided sufficient inputs to balance this "mining" effect, ensuring the soil was not left exhausted after harvest.
Statistical Significance and Reliability
The impacts on Nitrogen, Phosphorus, Sulfur, and Boron were found to be statistically significant, confirming that the observed improvements were a direct result of the specific treatment applications rather than environmental variance. Conversely, the non-significant results for Organic Matter and Potassium suggest these pools are more stable or slower to respond within a single cropping cycle.
5. Final Recommendation
For optimized soil health and high-intensity cultivation, Treatment T5 is recommended as the superior management strategy. It effectively bridges the gap between high crop demand and nutrient replenishment, preventing the severe phosphorus and sulfur mining observed in the control (T0) and other lower-tier treatments.
Abbreviations

LS

Level of Significance

NS

Non- significant Differences

Author Contributions
Sabia Sultana: Conceptualization, Investigation, Methodology, Resources, Writing – original draft, Writing – review & editing
Md. Redwanur Rahman: Conceptualization, Methodology, Project administration, Validation, Supervision, Writing – review & editing
Conflicts of Interest
The authors declare no conflicts of interest.
References
[1] Gutierrez, R. M., Velazquez, E. G. and Carrera, S. P. P (2019). Spinacia oleracea Linn considered as one of the most perfect foods: A pharmacological and phytochemical review. Mini reviews in medicinal chemistry., 19(20): 1666-1680,
[2] Toledo, M. E. A., Y. Ueda., Y. Imahori and M Ayaki. 2003. L-ascorbic acid metabolism in spinach (Spinacia oleracea L.) during postharvest storage in light and dark. Post Harvest Biol. Terminol., 28: 47-57,
[3] Cho, M. J., L. R. Howard., R. L. Prior and T. Morelock. 2008. Flavonoid content and antioxidant capacity of spinach genotypes determined by high-performance liquid chromatography/mass spectrometry. j. Dci. FoodAgri. 88: 1099-1106,
[4] Rabie, K., A. E., H. M. Ashour and H. H. Manaf, 2014. Influence of nitrogen forms on nitrate and nitrite accumulation in the edible parts of spinach (Spinacia oleracea L.) plant with maintenance for yield production. J. Horti. Sci. Ornamental Plants, 6(3)126-132,
[5] Morelock, T. E., Correll, J. C. 2008. Spinach, in Vegetables I: Asteraceae, Brassicaceae, Chenopodiaceae, and Cucurbitaceae: Prohens, J., Nuez, F., Eds; Springer: New York, NY, USA, 2008pp189-218,
[6] Subbaiah, P. V. 2019. Effect of inorganic and organic sources of nutrients and their conjunctive use on soil health. Journal of pharmacognosy and Phytochemistry. 8(4): 1352-1357,
[7] Verma, B. C., Pramanik, P., Bhaduri, D. (2020). Organic Fertilizers for Sustainable Soil and Environmental Management. In: Meena, R. (eds) Nutrient Dynamics for Sustainable Crop Production. Springer, Singapore.
[8] Pahalvi, H. N., Rafiya, L., Rashid, S., Nisar, B., Kamili, A. N. (2021). Chemical Fertilizers and Their Impact on Soil Health. In: Dar, G. H., Bhat, R. A., Mehmood, M. A., Hakeem, K. R. (eds) Microbiota and Biofertilizers, Vol 2. Springer, Cham.
[9] Singh, T. B. Ali, A., Prasad, M., Yadav, A., Shrivastav, P., Goyal, D. Dantu, P. K. (2020). Role of Organic Fertilizers in Improving Soil Fertility. In: Naeem, M., Ansari, A., Gill, S. (eds) Contaminants in Agriculture. Springer, Cham.
[10] Wei, K., Chen, Z. H., Jiang, N., Zhang, Y. L., Feng, J., Tian, Chen, X., Low, C., Chen, L. (2021). Effects of mineral phosphorus fertilizer reduction and maize straw incorporation on soil phosphorus availability, acid phosphatase activity, and maize grain yield in northeast China. Arch. Agron. Soil Sci 67, 66–78.
[11] Zheng, J., Shi, G., Dini-Andreote, F., Yang, Y., and Jiang, Y. (2025). Root-derived low molecular weight organic acids modulate keystone microbial taxa impacting plant phosphorus acquisition. Journal of Advanced Research (in press),
[12] Walkley, A. C. and Black, T. A. (1935). Estimation of soil organic carbon by chromic acid titration method. Soil Science, 47: 29-38,
[13] Olsen, S. R. and Sommers, L. E. (1982). Phosphorus In: Methods of Soil Analysis Part 2 (2nd Editions). American Society of Agronomy, Madison Wisconsin, USA, pp. 403-427,
[14] Page AL, Miller RH and Keeney DR (1982). Method of Soil Analysis Part 2 (2nd Editions). American Society of Agronomy, Madison Wisconsin, USA,
[15] Brautigan DJ, Rengasamy P and Chittleborough DJ (2014). Amelioration of alkaline phytotoxicity by lowering soil pH. Crop and Pasture Science, 65(12): 1278-1287.
[16] Bhogal, A., Nicholson, F. A., Rollett, A., Taylor, M., Litterick, A., Whittingham, M. J. and Williams, J. R. (2018). Improvements in the quality of agricultural soils following organic material additions depend on both the quantity and quality of the materials applied. Frontiers in Sustainable Food Systems, 2: 1-13.
[17] Iqbal, T., Jilani, G., Chaudhry, A. N. and Zahid, A. (2008). Studies on the residual effect of poultry litter application under wheat-maize cropping system. Presented and abstracted in the 12th Congress of Soil Science Society of Pakistan, pp. 20-23.
[18] Gao, M., Lu, X., Huang, Y., Liu, N. and Yang, J. (2017). Impact of long-term application fertilizer on soil total Sulphur and valid Sulphur. In: IOP Conference Series: Materials Science and Engineering, 207(1): 1-6,
[19] Antil, R. S. and Singh, M. (2007). Effects of organic manures and fertilizers on organic matter and nutrients status of the soil. Archives of Agronomy and Soil Science, 53(5): 519-528.
Cite This Article
  • APA Style

    Sultana, S., Rahman, M. R. (2026). Comparison of Effect of Organic and Inorganic Fertilizer on Soil Chemical Properties in Spinach Production. American Journal of Environmental and Resource Economics, 11(1), 14-23. https://doi.org/10.11648/j.ajere.20261101.12

    Copy | Download

    ACS Style

    Sultana, S.; Rahman, M. R. Comparison of Effect of Organic and Inorganic Fertilizer on Soil Chemical Properties in Spinach Production. Am. J. Environ. Resour. Econ. 2026, 11(1), 14-23. doi: 10.11648/j.ajere.20261101.12

    Copy | Download

    AMA Style

    Sultana S, Rahman MR. Comparison of Effect of Organic and Inorganic Fertilizer on Soil Chemical Properties in Spinach Production. Am J Environ Resour Econ. 2026;11(1):14-23. doi: 10.11648/j.ajere.20261101.12

    Copy | Download

  • @article{10.11648/j.ajere.20261101.12,
      author = {Sabia Sultana and Md. Redwanur Rahman},
      title = {Comparison of Effect of Organic and Inorganic Fertilizer on Soil Chemical Properties in Spinach Production},
      journal = {American Journal of Environmental and Resource Economics},
      volume = {11},
      number = {1},
      pages = {14-23},
      doi = {10.11648/j.ajere.20261101.12},
      url = {https://doi.org/10.11648/j.ajere.20261101.12},
      eprint = {https://article.sciencepublishinggroup.com/pdf/10.11648.j.ajere.20261101.12},
      abstract = {The research work was conducted in November 2024 at Field laboratory of Institute of Environmental Science, Rajshahi University Rajshahi to study the comparison of effect of organic and inorganic fertilizer on soil chemical properties in Spinach production. There were six treatments in this experiment. The experiment was laid out in randomized complete block design (RCBD) with three replications. Each block was compacted with a 6unit plot. Thus, the total numbers of unit plots were 18. The unit plot was 4m×1.25m = 5.0m2 having plot to plot 0.5m and 1m from surrounding the boundary. The unit plots were separated with earthen bunds to avoid nutrient transfer to besides plot by lateral seepage. This study evaluated the impact of six different soil treatments (T0–T5) on the dynamics of soil organic matter (SOM), macronutrients (N, P, K), and micronutrients (S, Zn, B) from pre-cultivation to post-harvest. Results indicate that while cultivation generally leads to nutrient depletion, specific management protocols can mitigate these losses and enhance soil fertility. Statistical analysis revealed that Total Nitrogen (TN) and Available Phosphorus (P) were significantly influenced by the treatments (and, respectively). Treatment T5 emerged as the superior protocol, achieving the highest net gains in TN (+0.04%) and Available P (+2.20 mg/kg). In contrast, the control (T0) and T2 experienced substantial phosphorus depletion (up to -10.02 mg/kg). A notable inverse relationship was observed between SOM and TN; while SOM decreased in most plots due to microbial mineralization, TN levels rose, suggesting a high rate of organic nitrogen conversion. Regarding micronutrients, Sulfur (S) and Boron (B) levels showed highly significant variations. T5 demonstrated the best performance in minimizing Sulfur loss (-1.46mg/kg) and maximizing Zinc (Zn) accumulation (+0.08mg/kg). Although changes in Exchangeable Potassium (K) and SOM were recorded as non-significant (NS), the numerical trends consistently favored T5 and T4 for maintaining nutrient stability. Overall, Treatment T5 provided the most balanced nutrient profile, effectively preventing the "nutrient mining" seen in other treatments. This study recommends T5 as an optimal strategy for sustaining soil health and ensuring long-term productivity in intensive cropping systems.},
     year = {2026}
    }
    

    Copy | Download

  • TY  - JOUR
    T1  - Comparison of Effect of Organic and Inorganic Fertilizer on Soil Chemical Properties in Spinach Production
    AU  - Sabia Sultana
    AU  - Md. Redwanur Rahman
    Y1  - 2026/04/10
    PY  - 2026
    N1  - https://doi.org/10.11648/j.ajere.20261101.12
    DO  - 10.11648/j.ajere.20261101.12
    T2  - American Journal of Environmental and Resource Economics
    JF  - American Journal of Environmental and Resource Economics
    JO  - American Journal of Environmental and Resource Economics
    SP  - 14
    EP  - 23
    PB  - Science Publishing Group
    SN  - 2578-787X
    UR  - https://doi.org/10.11648/j.ajere.20261101.12
    AB  - The research work was conducted in November 2024 at Field laboratory of Institute of Environmental Science, Rajshahi University Rajshahi to study the comparison of effect of organic and inorganic fertilizer on soil chemical properties in Spinach production. There were six treatments in this experiment. The experiment was laid out in randomized complete block design (RCBD) with three replications. Each block was compacted with a 6unit plot. Thus, the total numbers of unit plots were 18. The unit plot was 4m×1.25m = 5.0m2 having plot to plot 0.5m and 1m from surrounding the boundary. The unit plots were separated with earthen bunds to avoid nutrient transfer to besides plot by lateral seepage. This study evaluated the impact of six different soil treatments (T0–T5) on the dynamics of soil organic matter (SOM), macronutrients (N, P, K), and micronutrients (S, Zn, B) from pre-cultivation to post-harvest. Results indicate that while cultivation generally leads to nutrient depletion, specific management protocols can mitigate these losses and enhance soil fertility. Statistical analysis revealed that Total Nitrogen (TN) and Available Phosphorus (P) were significantly influenced by the treatments (and, respectively). Treatment T5 emerged as the superior protocol, achieving the highest net gains in TN (+0.04%) and Available P (+2.20 mg/kg). In contrast, the control (T0) and T2 experienced substantial phosphorus depletion (up to -10.02 mg/kg). A notable inverse relationship was observed between SOM and TN; while SOM decreased in most plots due to microbial mineralization, TN levels rose, suggesting a high rate of organic nitrogen conversion. Regarding micronutrients, Sulfur (S) and Boron (B) levels showed highly significant variations. T5 demonstrated the best performance in minimizing Sulfur loss (-1.46mg/kg) and maximizing Zinc (Zn) accumulation (+0.08mg/kg). Although changes in Exchangeable Potassium (K) and SOM were recorded as non-significant (NS), the numerical trends consistently favored T5 and T4 for maintaining nutrient stability. Overall, Treatment T5 provided the most balanced nutrient profile, effectively preventing the "nutrient mining" seen in other treatments. This study recommends T5 as an optimal strategy for sustaining soil health and ensuring long-term productivity in intensive cropping systems.
    VL  - 11
    IS  - 1
    ER  - 

    Copy | Download

Author Information